The Two Major Models of Economics as a "Science"
Optimization
Agents have objectives they value
Agents face constraints
Make tradeoffs to maximize objectives within constraints

The Two Major Models of Economics as a "Science"
Optimization
Agents have objectives they value
Agents face constraints
Make tradeoffs to maximize objectives within constraints
Equilibrium
Agents face competition from others that affect prices
Agents adjust their behaviors based on prices
Stable outcomes result where all agents cease adjusting

Consumer Behavior
How do people decide:
- which products to buy
- which activities to dedicate their time to
- how to save or invest/plan for the future
A model of behavior we can extend to most scenarios
Answers to these questions are building blocks for demand curves

Individuals and Consumers
Everyone is a consumer
- Recall we need not limit "goods and services" to food, clothing, etc. - theyr are anything that you value!
Consumers making purchasing decisions will be our paradigmatic example
- But we are really talking about how individuals make choices in almost any context!
Constrained Optimization I
We model most situations as a constrained optimization problem:
People optimize: make tradeoffs to achieve their objective as best as they can
Subject to constraints: limited resources (income, time, attention, etc)
Constrained Optimization II
One of the most generally useful mathematical models
Endless applications: how we model nearly every decision-maker
consumer, business firm, politician, judge, bureaucrat, voter, dictator, pirate, drug cartel, drug addict, parent, child, etc
Key economic skill: recognizing how to apply the model to a situation
Luckily, all models have a common setup...
Constrained Optimization III
- All constrained optimization models have three moving parts:
Constrained Optimization III
- All constrained optimization models have three moving parts:
- Choose: < some alternative >
Constrained Optimization III
- All constrained optimization models have three moving parts:
Choose: < some alternative >
In order to maximize: < some objective >
Constrained Optimization III
- All constrained optimization models have three moving parts:
Choose: < some alternative >
In order to maximize: < some objective >
Subject to: < some constraints >
Constrained Optimization: Example I
Example: A Hood student picking courses hoping to achieve the highest GPA while getting an Econ major.
Choose:
In order to maximize:
Subject to:

Constrained Optimization: Example II
Example: How should FedEx plan its delivery route?
Choose:
In order to maximize:
Subject to:

Constrained Optimization: Example III
Example: The U.S. government wants to remain economically competitive but reduce emissions by 25%.
Choose:
In order to maximize:
Subject to:

Constrained Optimization: Example IV
Example: How do elected officials make decisions in politics?
Choose:
In order to maximize:
Subject to:

The Consumer's Problem
- The consumer's constrained optimization problem is:
The Consumer's Problem
- The consumer's constrained optimization problem is:
- Choose: < a consumption bundle >
The Consumer's Problem
- The consumer's constrained optimization problem is:
Choose: < a consumption bundle >
In order to maximize: < utility >
The Consumer's Problem
- The consumer's constrained optimization problem is:
Choose: < a consumption bundle >
In order to maximize: < utility >
Subject to: < income and market prices >
Consumption Bundles
Imagine a (very strange) supermarket sells xylophones (x) and yams (y)
Your choices: amounts of x,y to buy as a bundle
Consumption Bundles
Imagine a (very strange) supermarket sells xylophones (x) and yams (y)
Your choices: amounts of x,y to buy as a bundle
We can represent your choices as a vector:
a=(xy)
Consumption Bundles
Imagine a (very strange) supermarket sells xylophones (x) and yams (y)
Your choices: amounts of x,y to buy as a bundle
We can represent your choices as a vector:
a=(xy)
Examples:
a=(412);b=(612);c=(210)
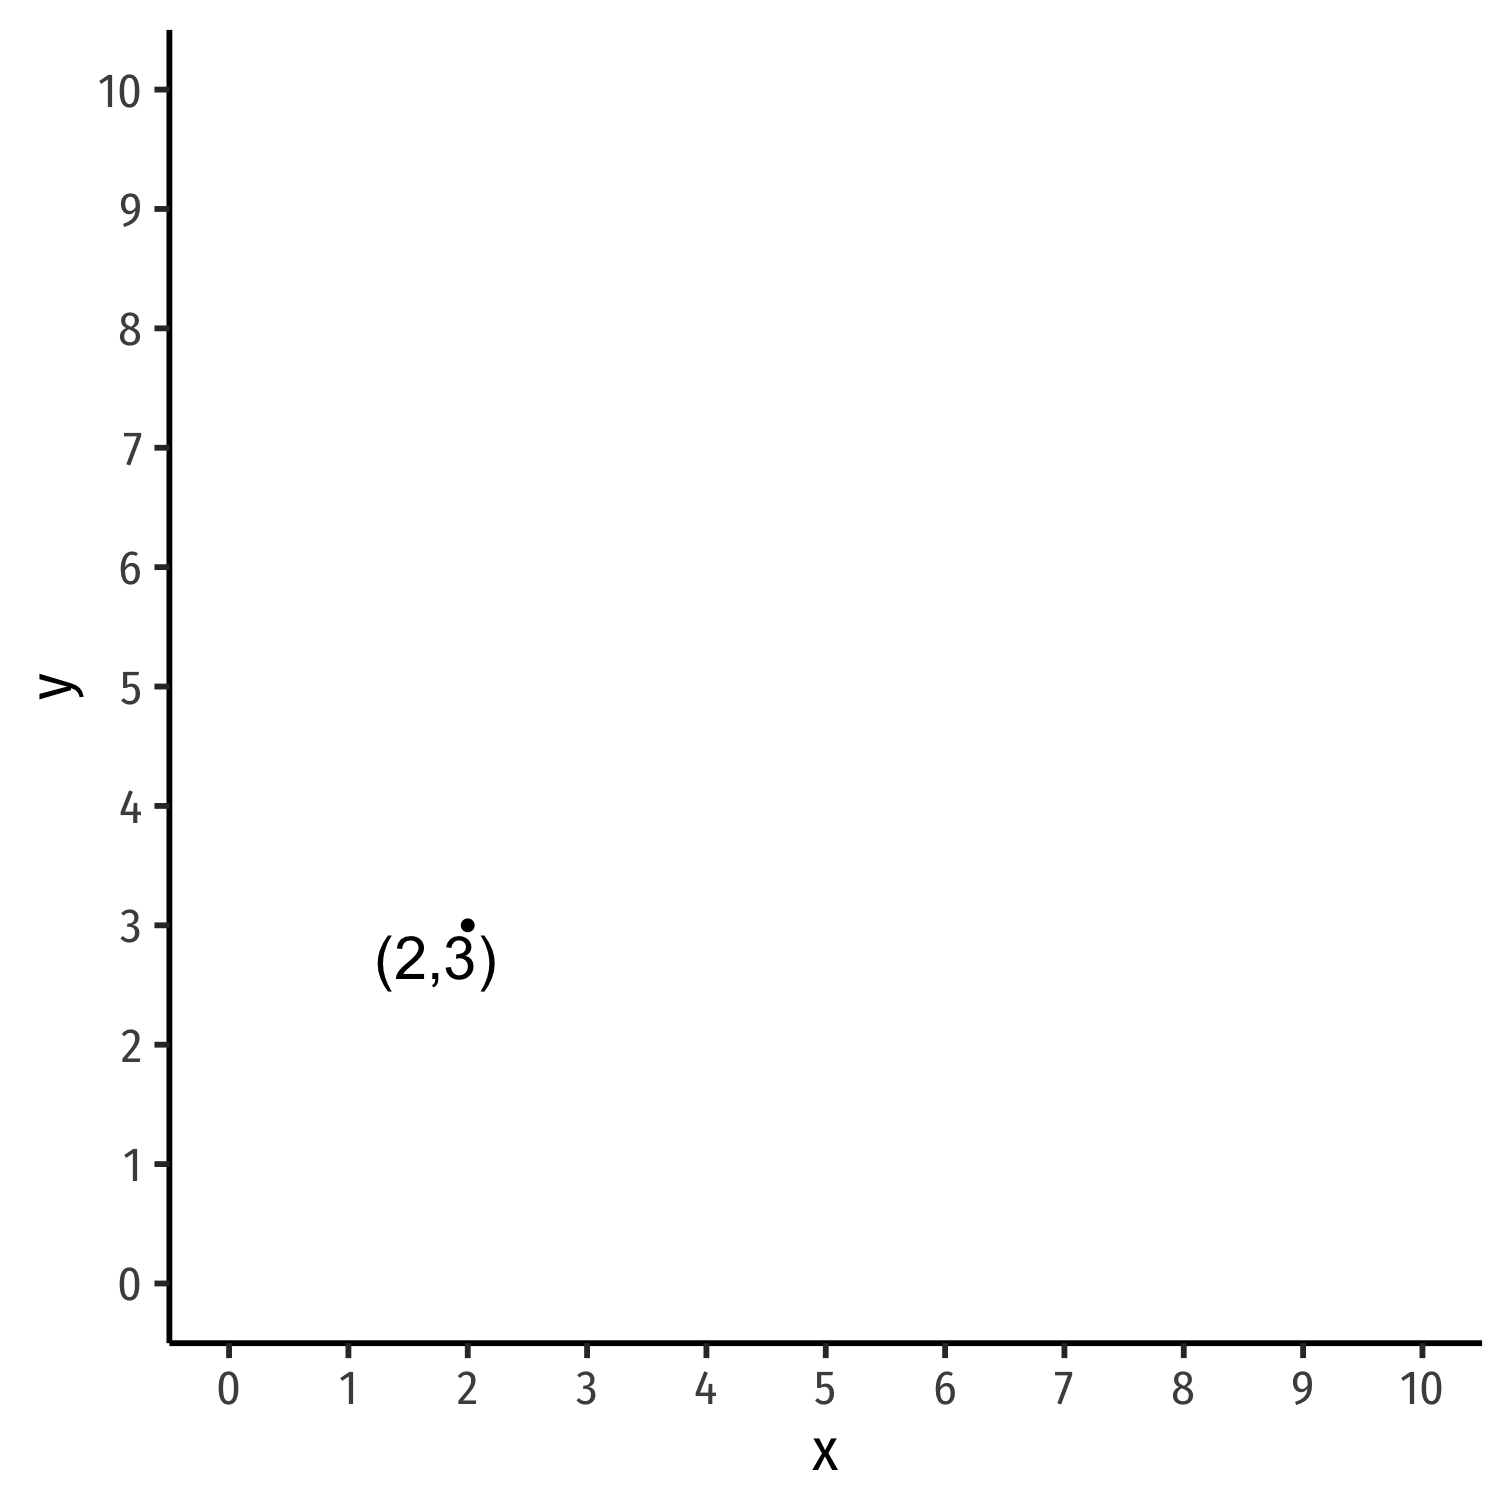
Consumption Bundles: Graphically
We can represent choices graphically
We'll stick with 2 goods (x,y) in 2-dimensions
Affordability
If you had $100 to spend, what bundles of goods {x,y} would you buy?
Only those bundles that are affordable
Denote prices of each good as {px,py}
Let m be the amount of income a consumer has
Affordability
If you had $100 to spend, what bundles of goods {x,y} would you buy?
Only those bundles that are affordable
Denote prices of each good as {px,py}
Let m be the amount of income a consumer has
A consumption bundle {x,y} is affordable at given prices {px,py} when:
pxx+pyy≤m
The Budget Set
- The set of all affordable bundles that a consumer can choose is called the budget set or choice set
pxx+py≤m
- The budget constraint is the set of all bundles that spend all income m:1
pxx+pyy=m
1 Note the difference (the in/equality), budget constraint is the subset of the budget set that spends all income.
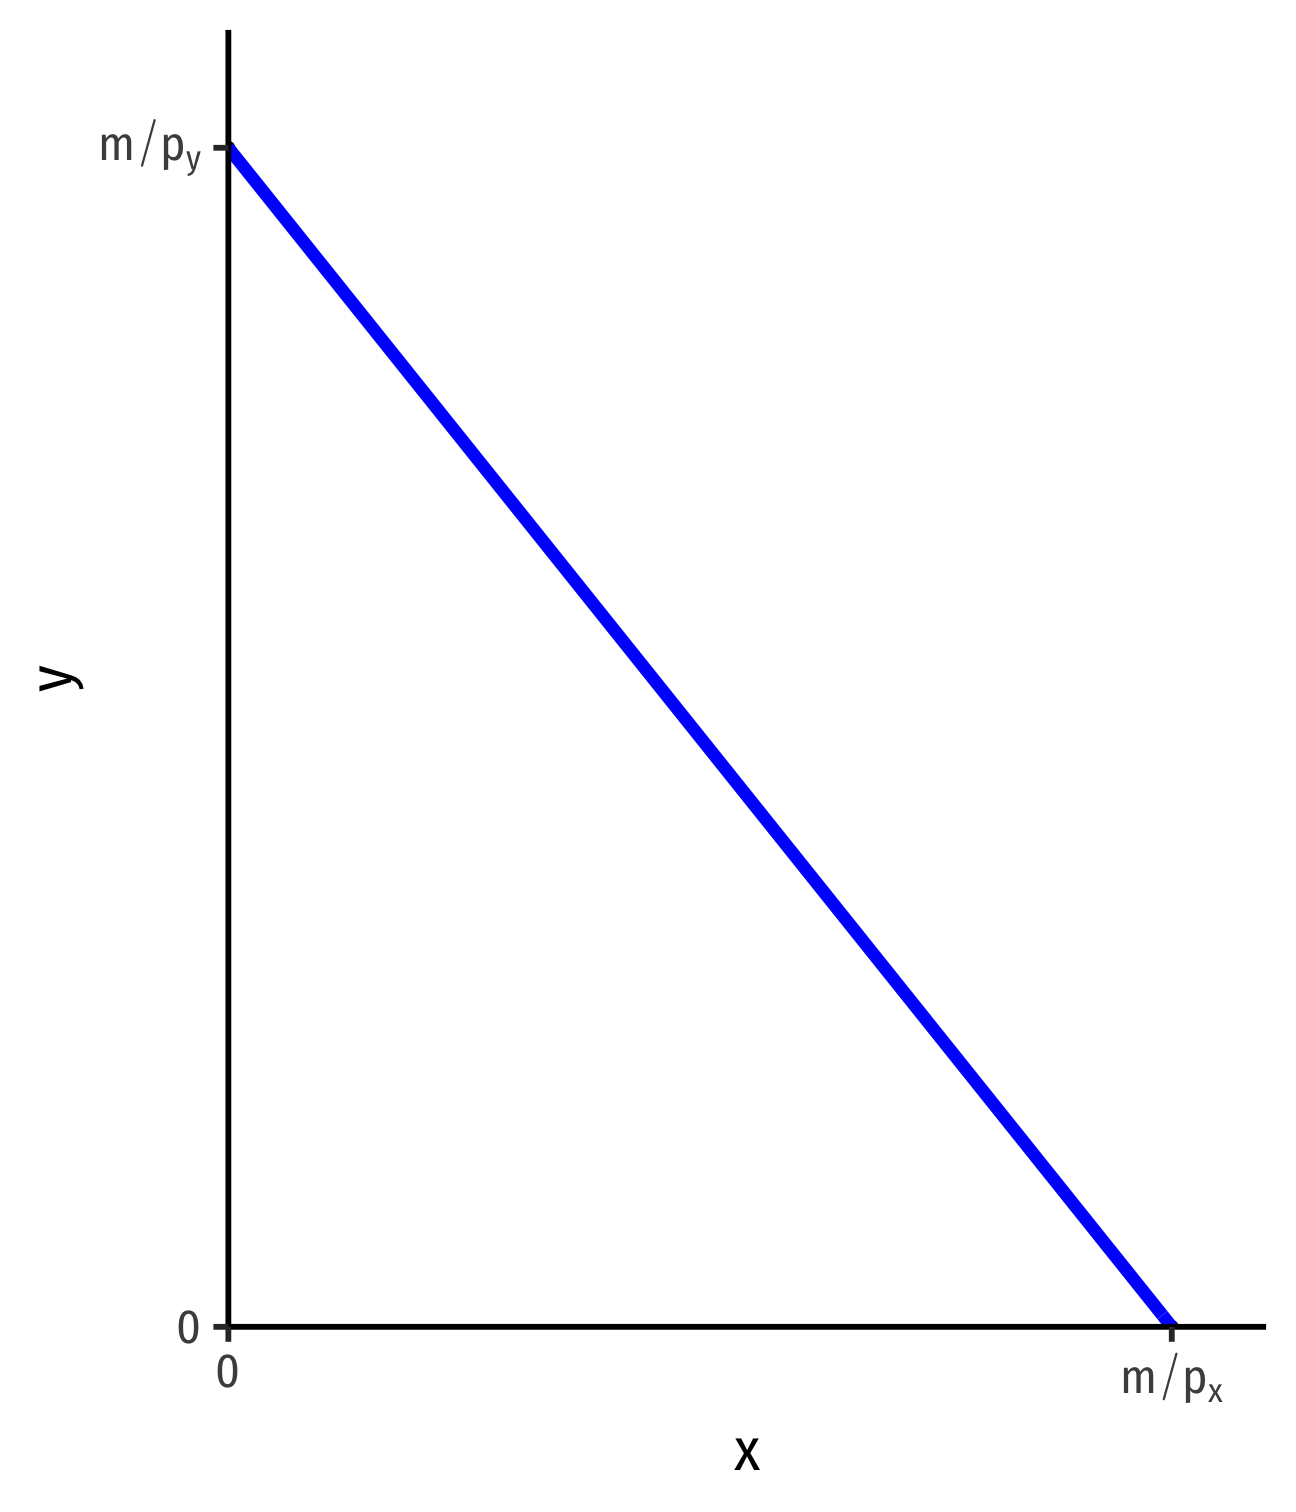
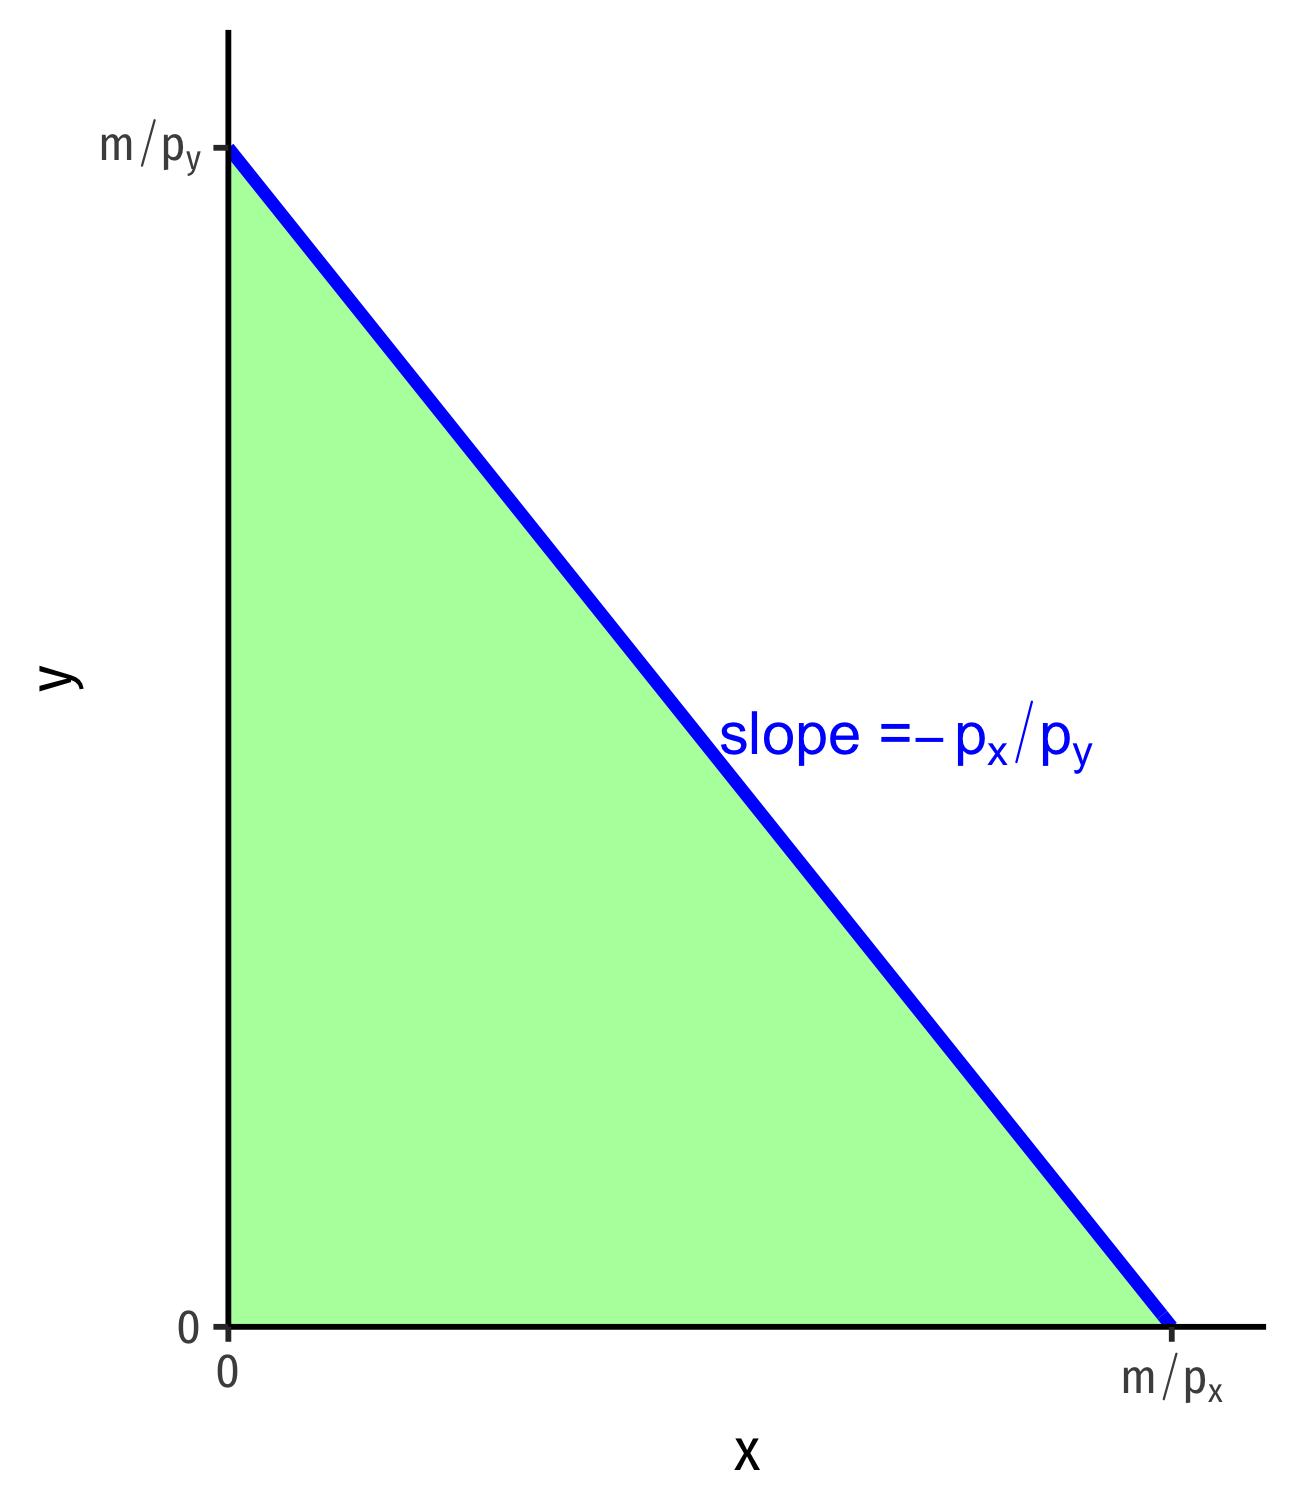
The Budget Constraint, Graphically
- For 2 goods, (x,y)
pxx+pyy=m
- Solve for y to graph
y=mpy−pxpyx
The Budget Constraint, Graphically
- For 2 goods, (x,y)
pxx+pyy=m
- Solve for y to graph
y=mpy−pxpyx
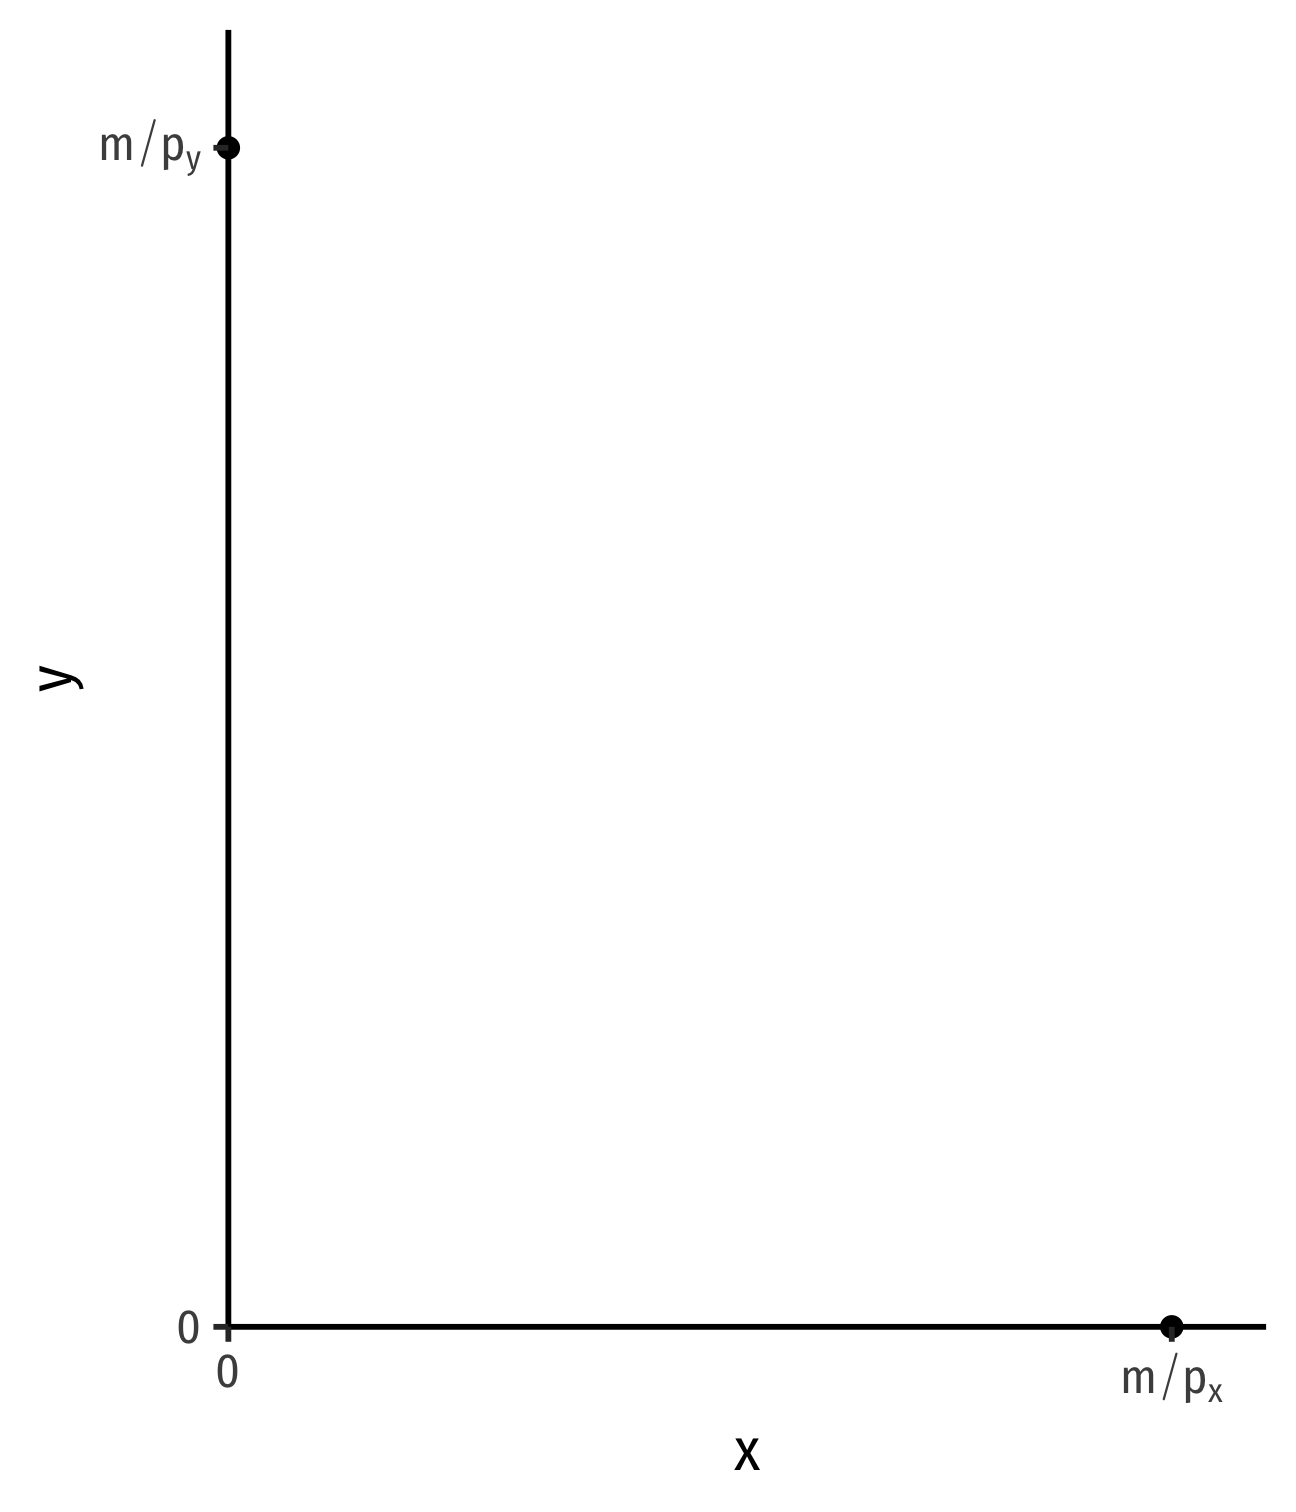
- y-intercept: mpy
- x-intercept: mpx
The Budget Constraint, Graphically
- For 2 goods, (x,y)
pxx+pyy=m
- Solve for y to graph
y=mpy−pxpyx
- y-intercept: mpy
- x-intercept: mpx
- slope: −pxpy
The Budget Constraint, Graphically
- For 2 goods, (x,y)
pxx+pyy=m
- Solve for y to graph
y=mpy−pxpyx
- y-intercept: mpy
- x-intercept: mpx
slope: pxpy
Budget constraint is the upper limit of the budget set
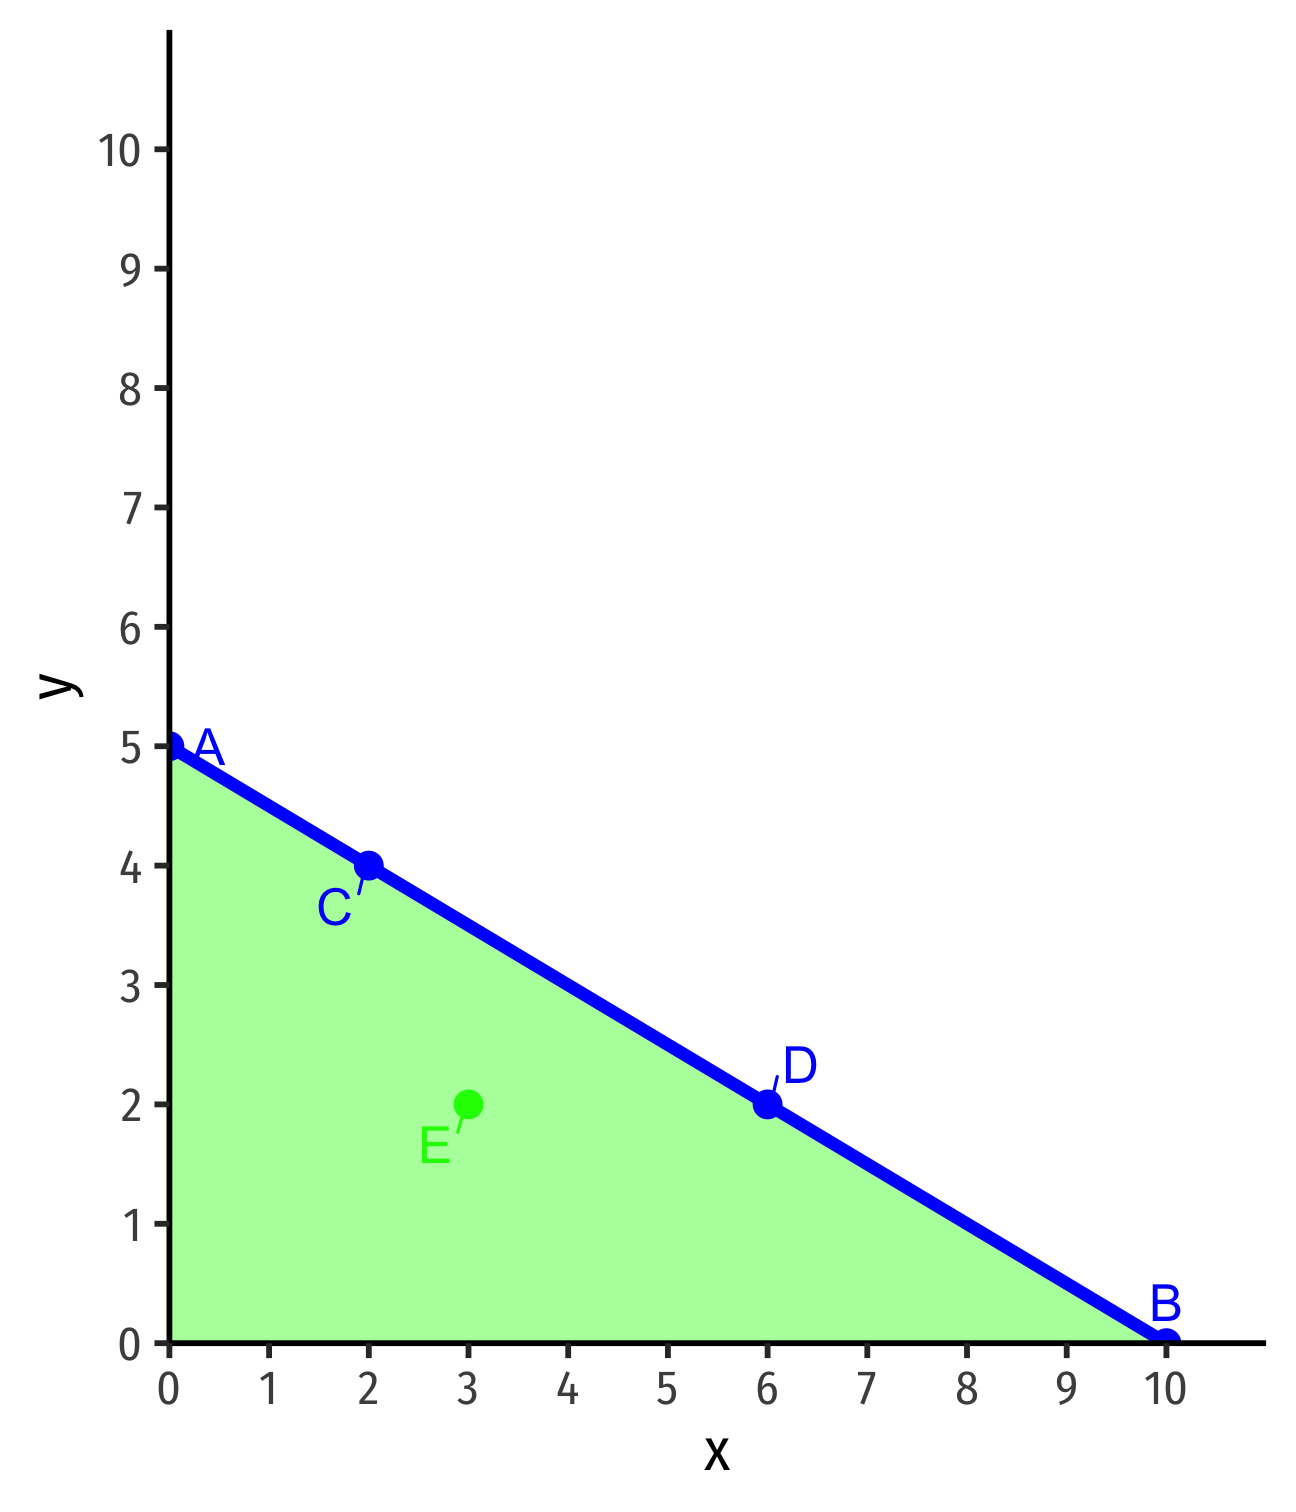
Interpreting the Budget Constraint
- Points on the line spend all income
- A: $5(0x)+$10(5y)=$50
- B: $5(10x)+$10(0y)=$50
- C: $5(2x)+$10(4y)=$50
- D: $5(6x)+$10(2y)=$50

Interpreting the Budget Constraint
Points on the line spend all income
- A: $5(0x)+$10(5y)=$50
- B: $5(10x)+$10(0y)=$50
- C: $5(2x)+$10(4y)=$50
- D: $5(6x)+$10(2y)=$50
Points beneath the line are affordable (in the budget set) but don't use all income
- E: $5(3x)+$10(2y)=$35
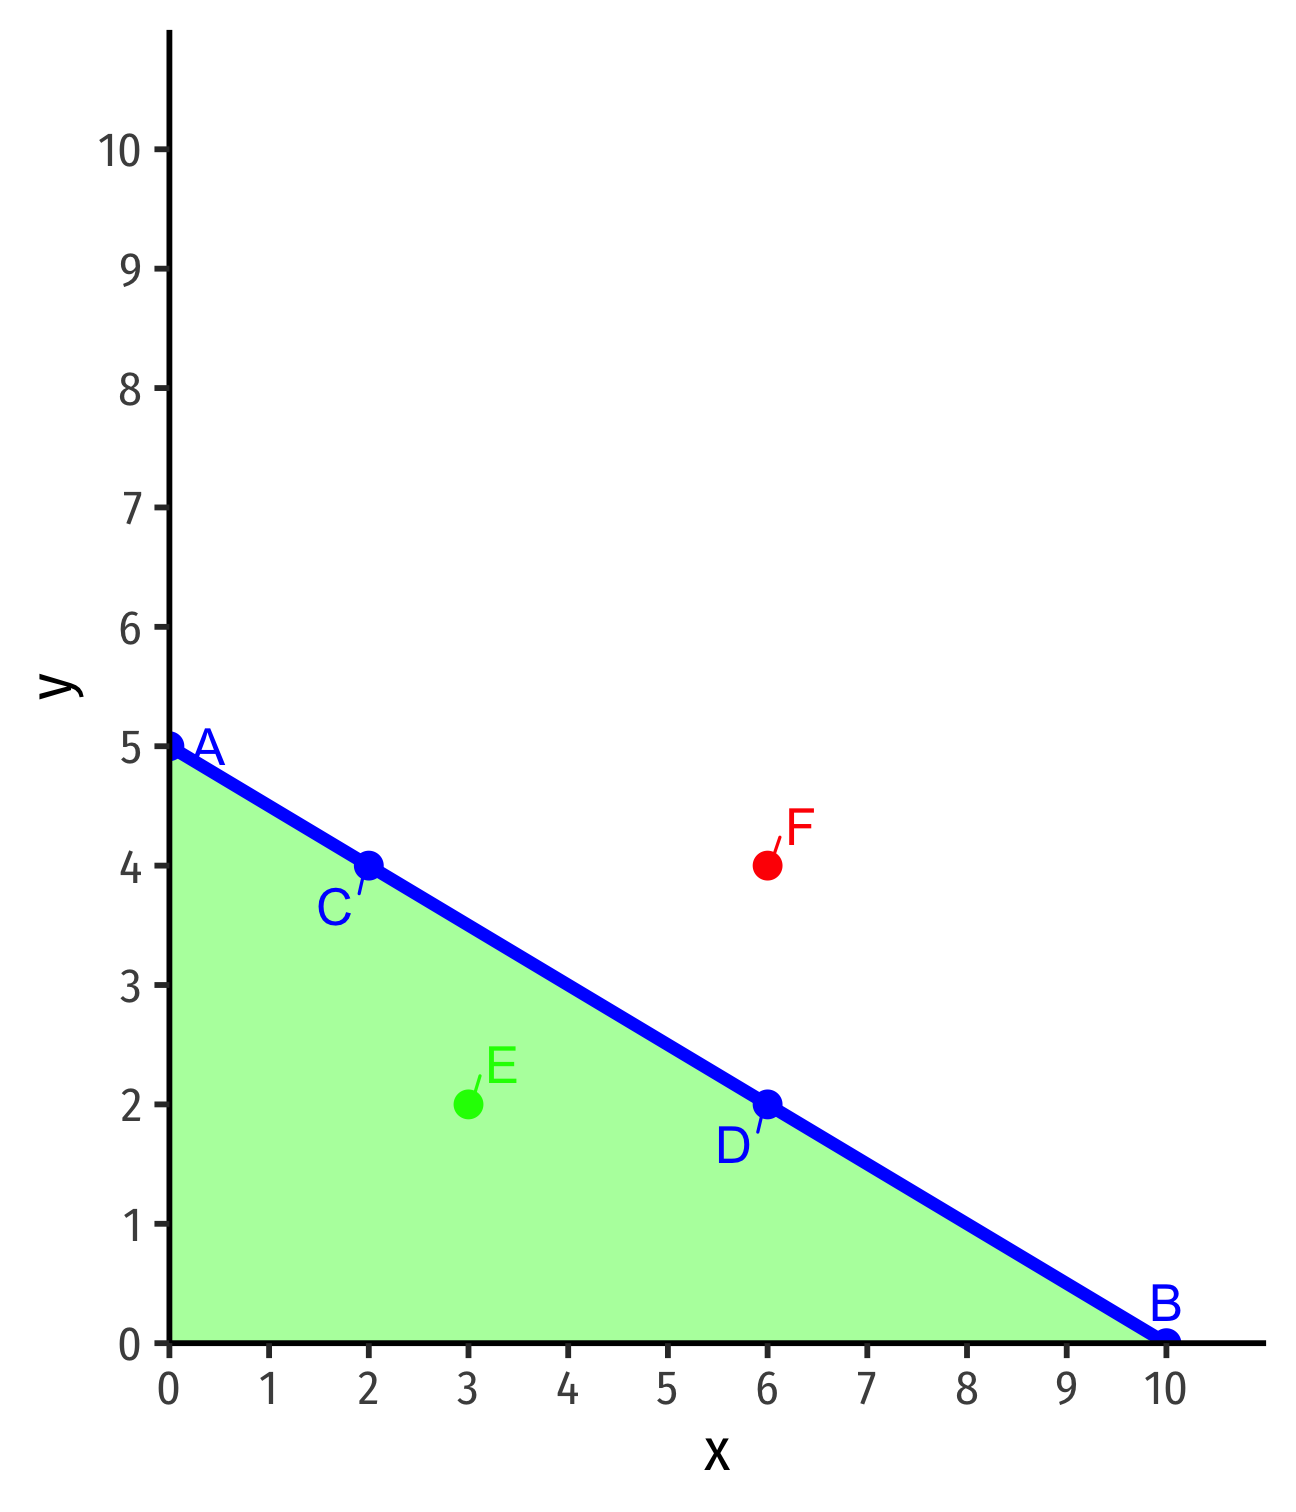
Interpreting the Budget Constraint
Points on the line spend all income
- A: $5(0x)+$10(5y)=$50
- B: $5(10x)+$10(0y)=$50
- C: $5(2x)+$10(4y)=$50
- D: $5(6x)+$10(2y)=$50
Points beneath the line are affordable (in the budget set) but don't use all income
- E: $5(3x)+$10(2y)=$35
Points above the line are unaffordable (at current income and prices)
- F: $5(6x)+$10(4y)=$70
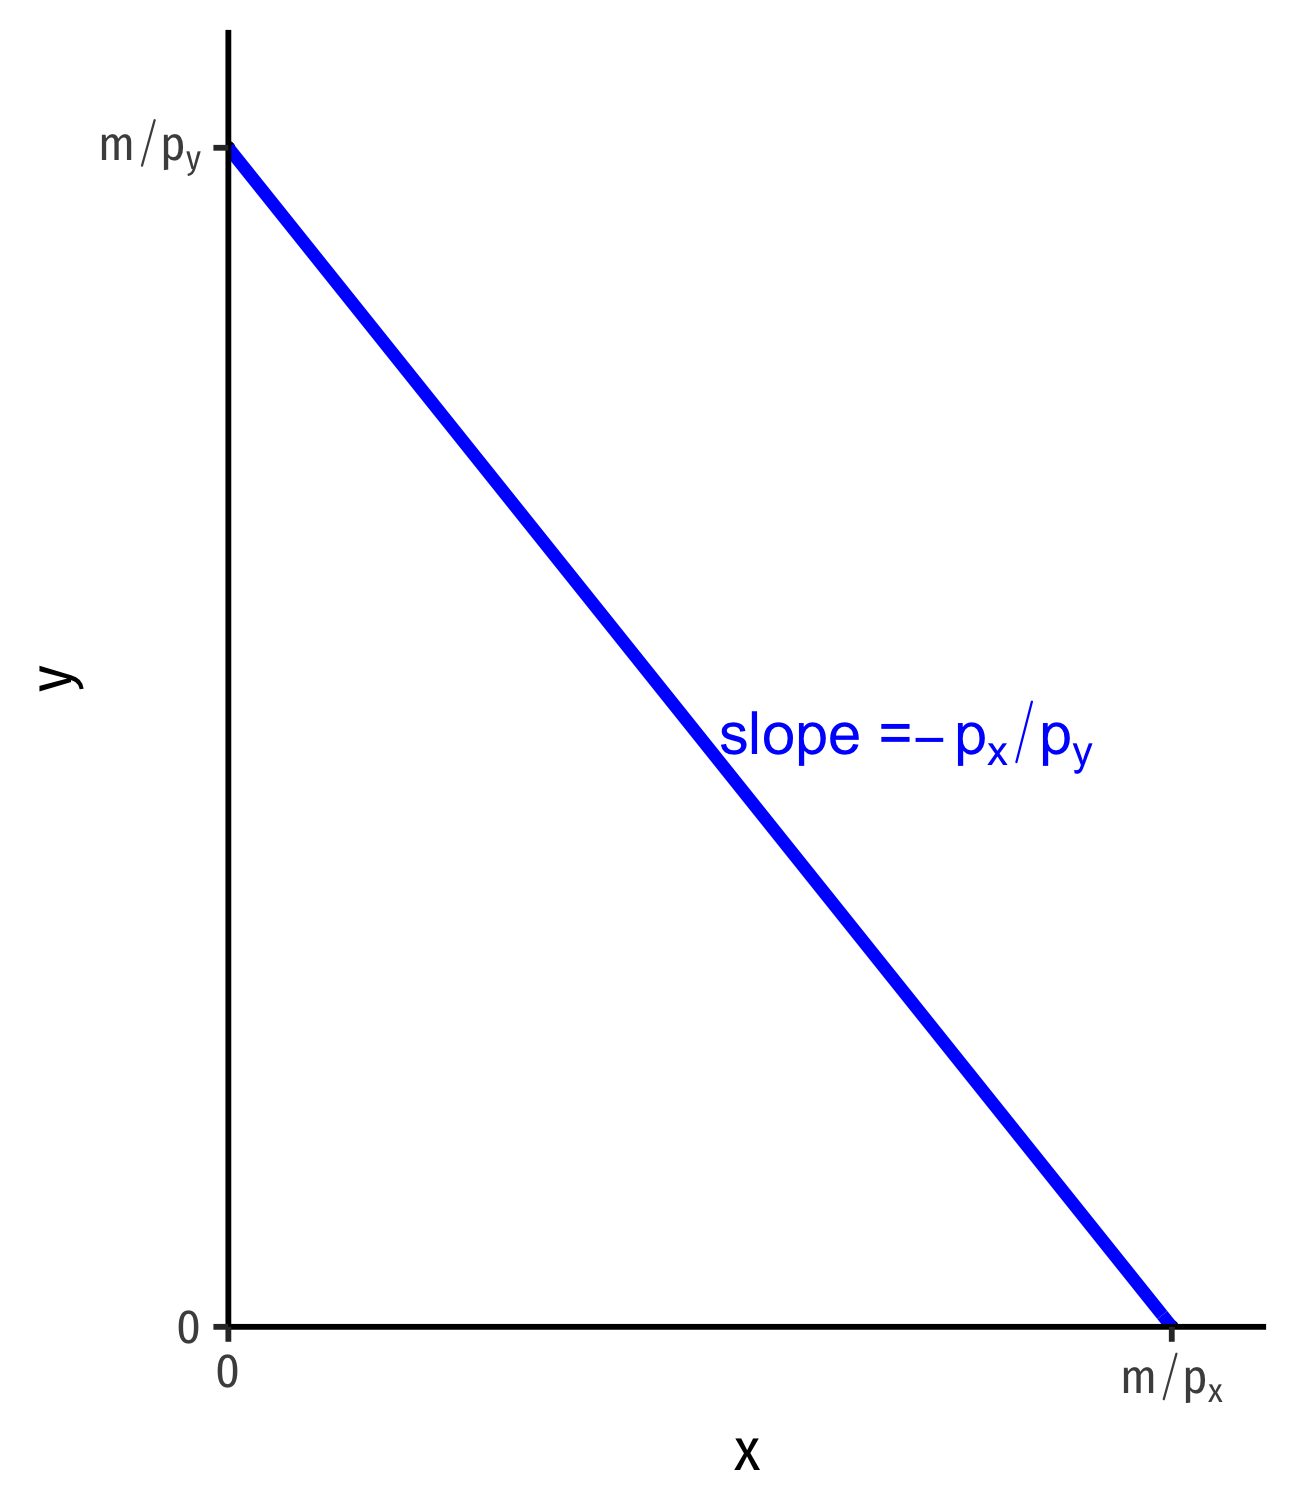
Interpretting the Slope
Slope: market-rate of tradeoff between x and y
Relative price of x or opportunity cost of x:
Consuming 1 more unit of x requires giving up pxpy units of y
Interpretting the Slope
Slope: market-rate of tradeoff between x and y
Relative price of x or opportunity cost of x:
Consuming 1 more unit of x requires giving up pxpy units of y
- Foreshadowing:
Is your valuation of the tradeoff between x and y the same as the market rate?

Changes in Parameters
m=pxx+pyyy=mpy−pxpyx
Budget constraint is a function of specific parameters
- m: income
- px,py: market prices
What happens to the budget constraint as these change?
Where economics begins: how changes in constraints affect people's choices

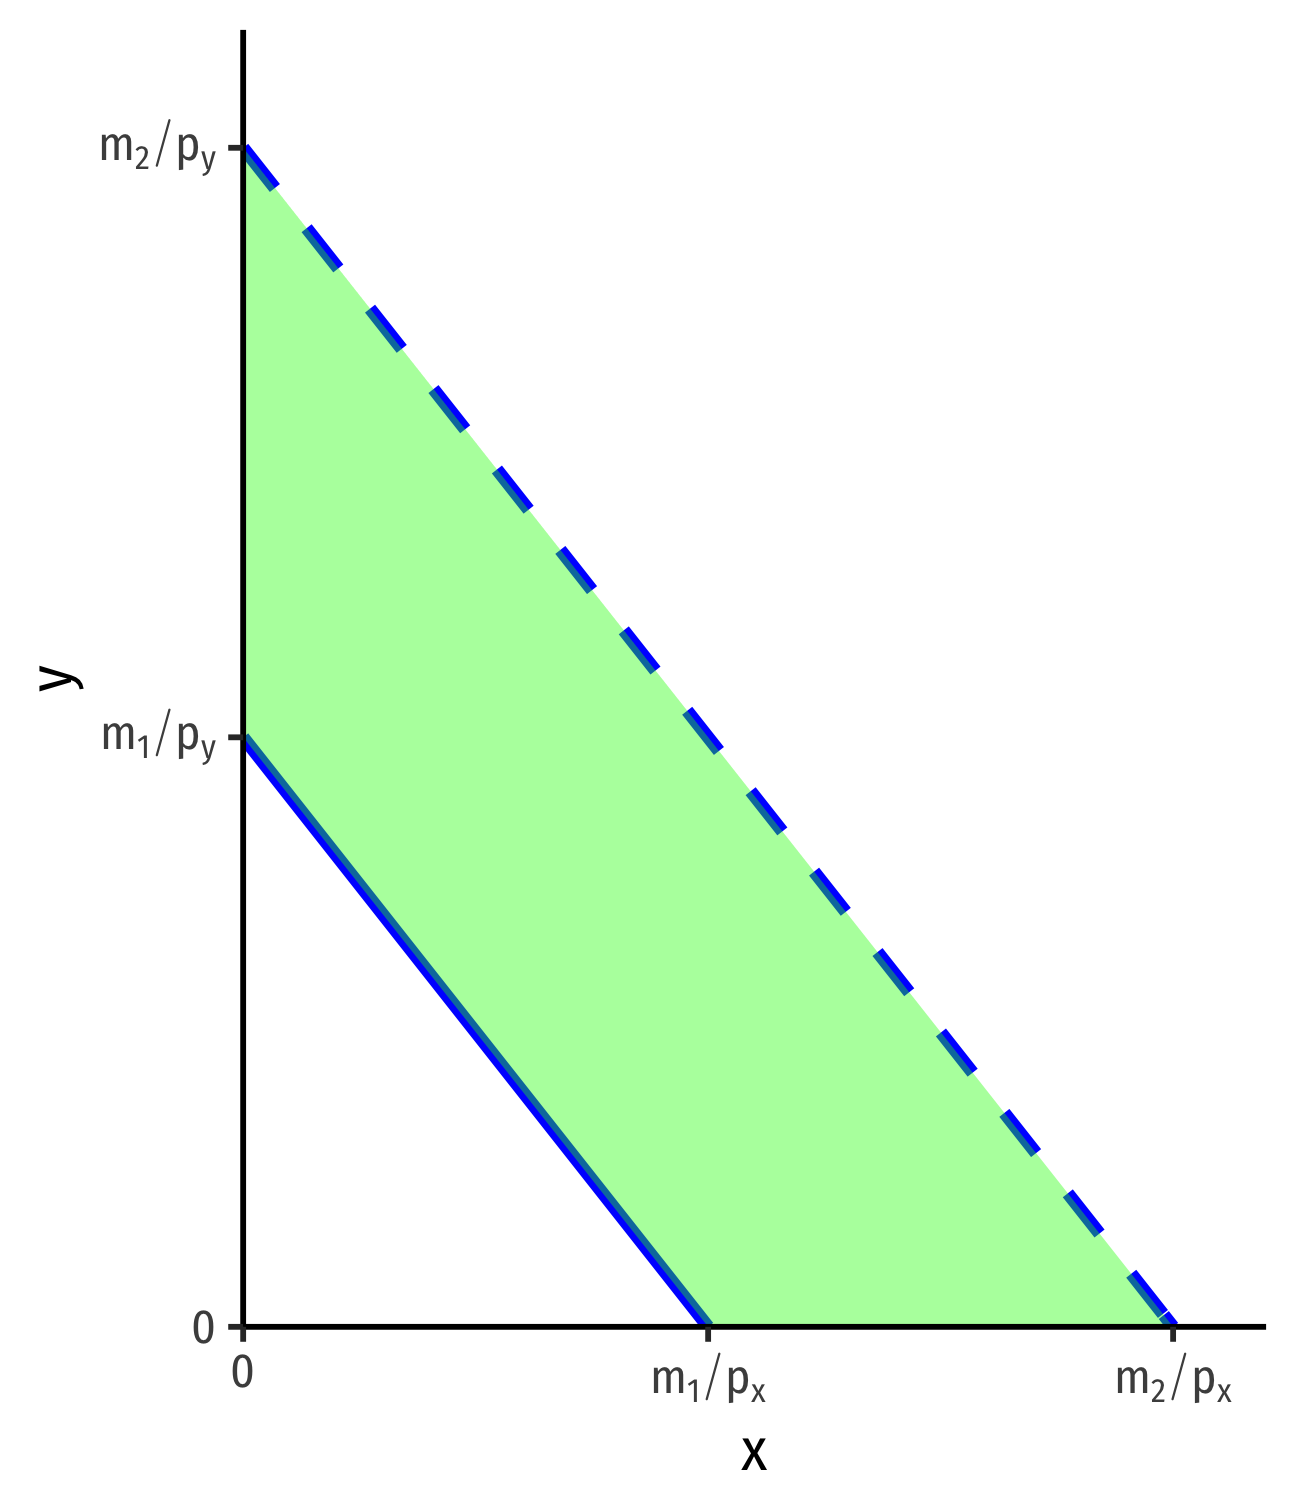
Changes in Income, m
- Changes in income: a parallel shift in budget constraint
Example: An increase in income
Same slope (relative prices don't change!)
Gain of affordable bundles
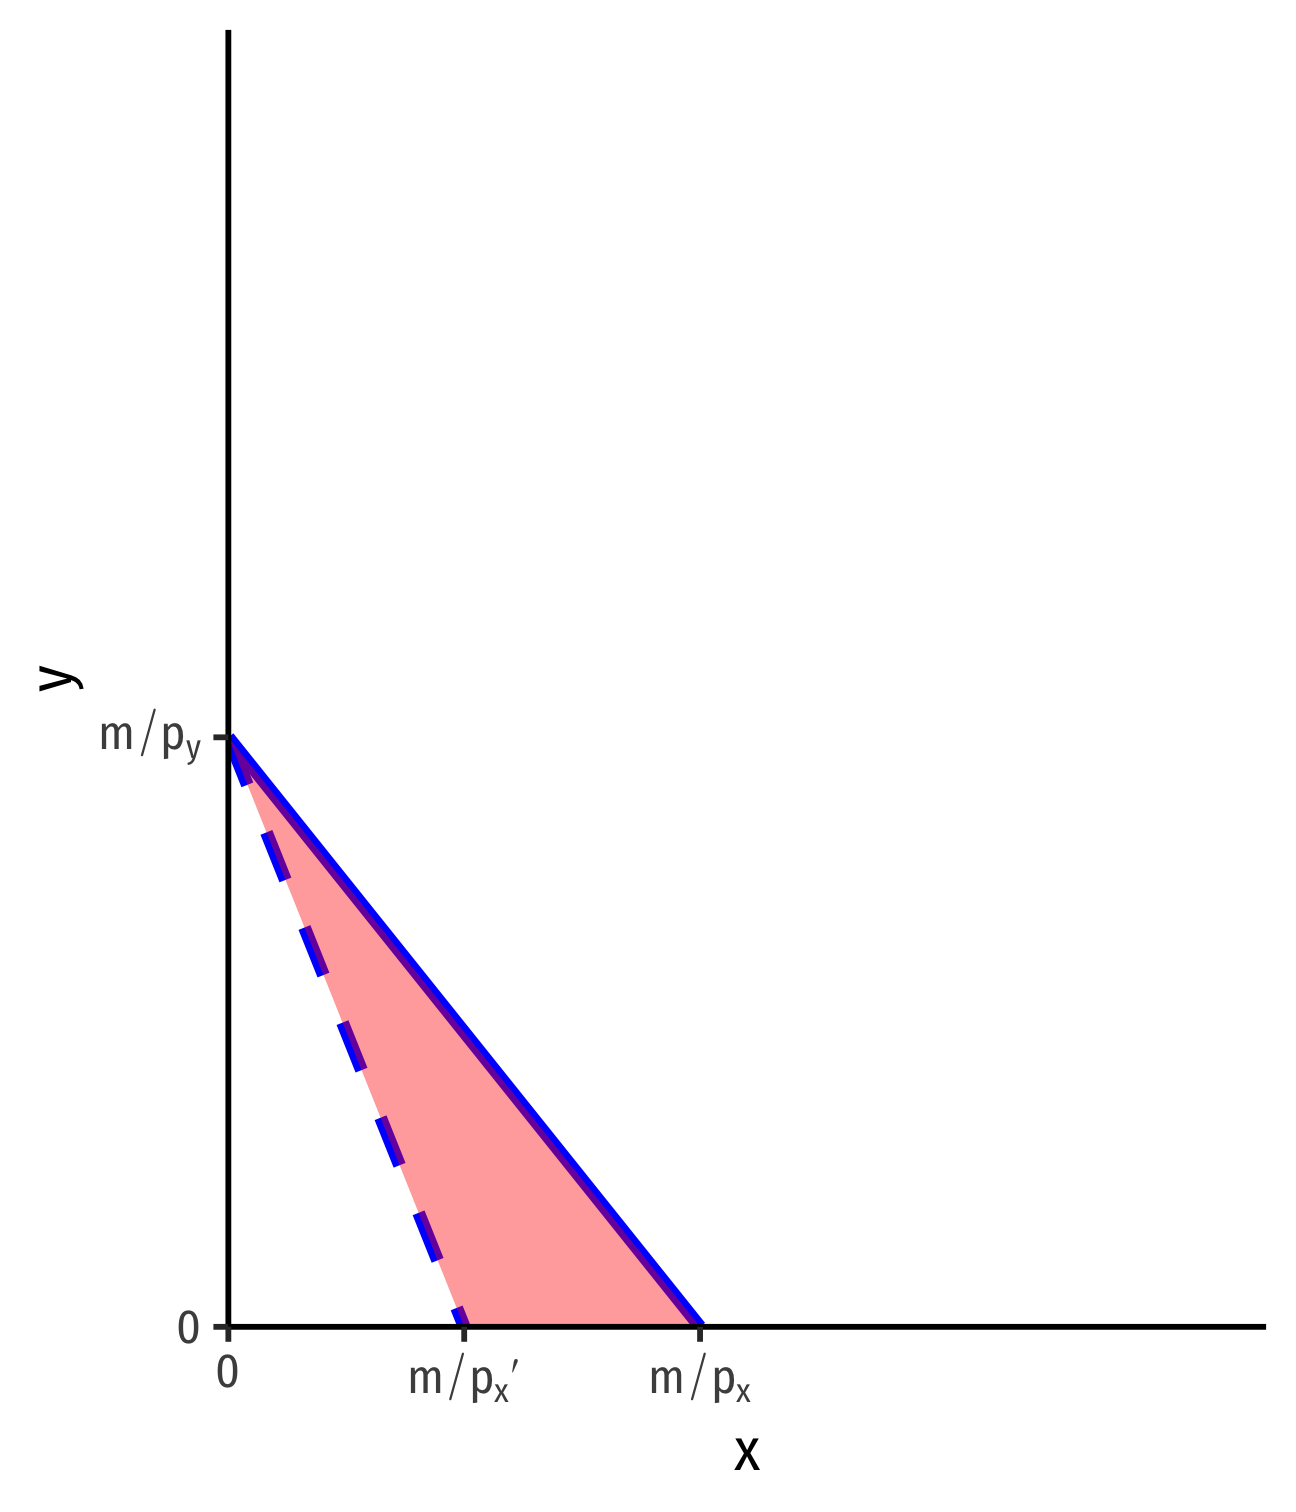
Changes in Relative Prices, px or py
- Changes in relative prices: rotate the budget constraint
Example: An increase in the price of x
Slope steepens: −p′xpy
Loss of affordable bundles
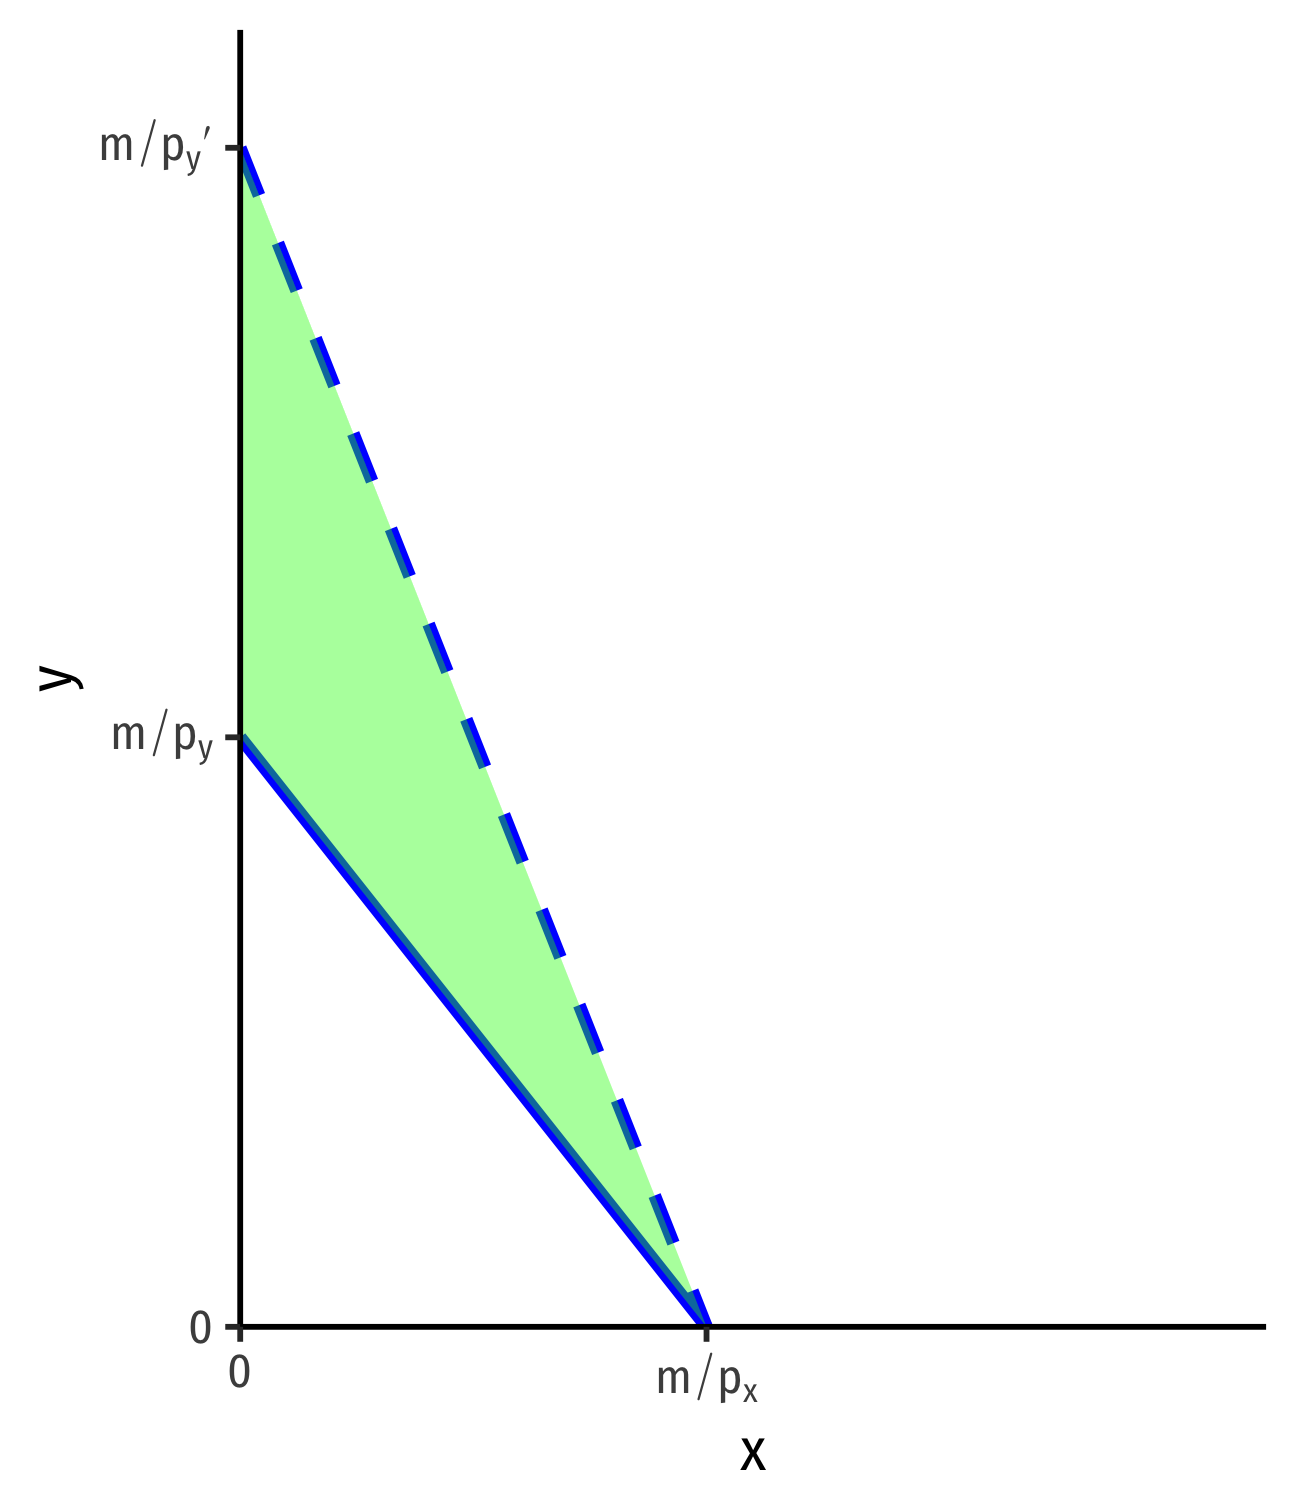
Changes in Relative Prices, px or py
- Changes in relative prices: rotate the budget constraint
Example: A decrease in the price of y
Slope flattens: −pxp′y
Gain of affordable bundles
Economics is About (Changes in) Relative Prices
Economics is about (changes in) relative prices
Budget constraint slope is (pxpy)
Only "real" changes in relative prices (from changes in market valuations) change consumer constraints
"Nominal" prices are often meaningless!

Economics is About (Changes in) Relative Prices
Economics is about (changes in) relative prices
Budget constraint slope is (pxpy)
Only "real" changes in relative prices (from changes in market valuations) change consumer constraints
"Nominal" prices are often meaningless!
Example: Imagine yourself in a strange country. All you know is that the price of bread is "6"...
- If all prices & incomes changed at the same rate...what would happen in real terms?